spectroscopy-py
Spectroscopy - Export Data
Table of Contents
Introduction

The Spectroscopy software allows seamless export of decay curves and phasors data to binary files, with convenient plotting and visualization capabilities. This guide provides an in-depth exploration of the binary files structure, offering a comprehensive understanding of how exported data is formatted and can be leveraged.
Spectroscopy File Format
Here a detailed explanation of the exported Spectroscopy binary data file structure:
Header (4 bytes):
The first 4 bytes of the file must be SP01. This serves as a validation check to ensure the correct format of the file. If the check fails, the script prints “Invalid data file” and exits.
Metadata Section (Variable length):
Following the header, metadata is stored in the file. This includes:
JSON length (4 bytes): An unsigned integer representing the length of the JSON metadata.JSON metadata: This is a variable-length string that contains information about the data, including enabled channels, bin width, acquisition time, laser period and tau ns. This information is printed to the console.
Data Records (Variable length):
After the metadata, the script enters a loop to read and process data in chunks of variable length, depending on the number of active channels. Each chunk represents a data record containing:
Timestamp (8 bytes): A double representing the data acquisition time in seconds.-
Channel Cumulated Curve Values (variable length): A variable number of unsigned integers (4 bytes each) representing cumulated decay curve for each active channel at the corresponding timestamp. For each active channel, 256 values are stored as 4-byte unsigned integers. The length of each data record is calculated as:- 8 bytes for the timestamp.
- 1024 bytes for each active channel (256 values of 4 bytes each).
For example, if there are 3 active channels, the total length of a data record will be 8 + 1024 * 3 = 3080 bytes.
Phasors File Format
Here a detailed explanation of the exported Phasors binary data file structure:
Header (4 bytes):
The first 4 bytes of the file must be SPF1. This serves as a validation check to ensure the correct format of the file. If the check fails, the script prints “Invalid phasors_data file” and exits.
Metadata Section (Variable length):
Following the header, metadata is stored in the file. This includes:
JSON length (4 bytes): An unsigned integer representing the length of the JSON metadata.JSON metadata: This is a variable-length string that contains information about the data, including enabled channels, bin width, acquisition time, laser period, harmonics and tau ns. This information is printed to the console.
Data Records (Variable length):
After the metadata, the script enters a loop to read and process phasor data. Each data record contains:
Timestamp (8 bytes): An unsigned integer representing the timestamp of the data in nanoseconds.Channel Index (4 bytes): A string representing the name of the channel index.g (8 bytes): A float representing the real part of the phasor (X axis).s (8 bytes): A float representing the imaginary part of the phasor (Y axis).
Data Visualization
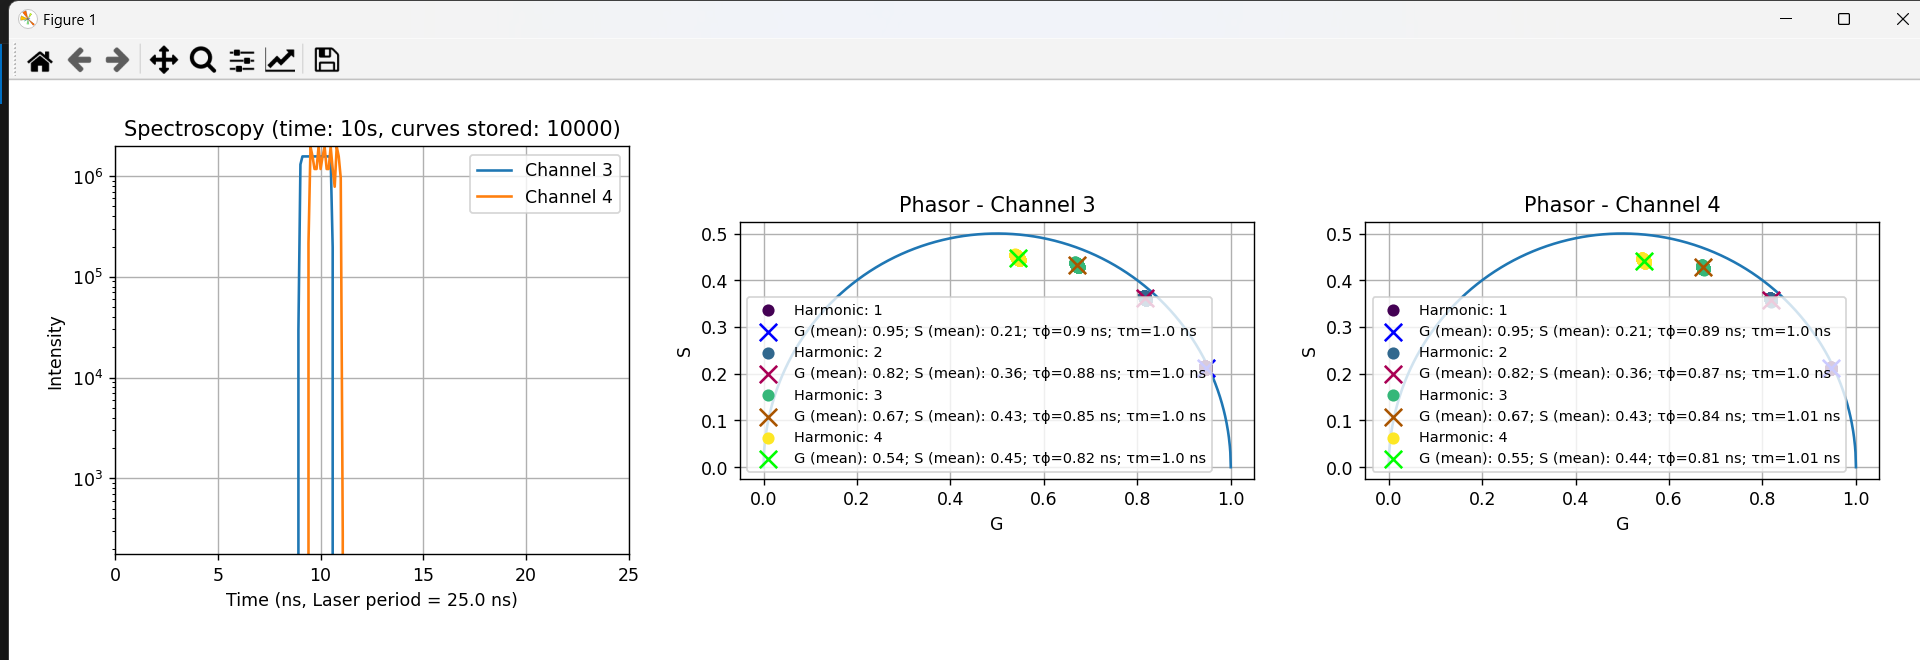
The script files are automatically downloaded along with the acquisition .bin file once the acquisition is complete and a file name has been chosen. Follow one of the guides below if you wish to use the Python or Matlab script:
-
Python script:
-
Open the terminal and navigate to the directory where the saved files are located (it is advisable to save and group them in a folder):
cd YOUR_DOWNLOADED_DATA_ROOT_FOLDER - Create a virtual environment using the command:
python -m venv venv - Activate the virtual environment with the command:
venv\Scripts\activate - Install the necessary dependencies listed in the automatically downloaded requirements.txt with:
pip install -r requirements.txt - Run your script with:
python YOUR_SCRIPT_NAME.py
-
-
Matlab script:
Simply open your MATLAB command window prompt and, after navigating to the folder containing the script, type the name of the script to launch it.
Useful Links
For more details about the project follow these links:
License
Distributed under the MIT License.
Contact
FLIM LABS: info@flimlabs.com
Project Link: FLIM LABS - Spectroscopy
